Click the icons below:

 Purpose:
The
purpose of this project was to allow each of us to explore a project of our
interest. I had wanted to make a spectrum analyzer for a while and this was the
perfect opportunity to finally do it. The visual aspect of the project always
interested me but recently I had the desire to understand how the project
works. This project was also chosen to prepare me for university. I wanted to
experience an assignment where little information existed and where it did
there was no explanation on how or why it worked.
Parts List:
*Note* These are only materials used for part 1 of the project
Quantity
|
Part
|
Description
|
1
|
Arduino (UNO)
|
|
1
|
Audio Cable 3.5mm
|
|
1
|
Audio Jack 3.5mm
|
|
1
|
Audio Jack Breakout
|
|
2
|
LM3914N
|
|
1
|
MSGEQ7
|
|
1
|
4017 Decade Counter
|
|
2
|
3904 Transistor
|
|
5
|
LED
|
|
4
|
LED Bargraphs
|
|
2
|
0.1uF Capacitor
|
|
1
|
33pF Capacitor
|
|
1
|
0.01uF Capacitor
|
|
1
|
220kΩ Resistor
|
|
8
|
2.2kΩ Resistor
|
|
1
|
20kΩ Resistor
|
|
3
|
10kΩResistor
|
|
1
|
47kΩResistor
|
|
40
|
1.3kΩResistor
|
|
Photo Gallery:
Version 1 Version 2 Version 3 Version 4


Procedure:
I started by researching other spectrum analyzer projects to see what parts they used and how their code looked. I found two sites that were usefull and decided that it was time to start building. Because I was determined to use LED bargraphs and my desired height was 20 LEDs tall, I had to find a way to drive all of the LEDs. This is where the LM3914N's come into play.
----------------------------------------------------------------------------------------------------------------------------------
LM3914N
The
LM3914 is a dot/bar display driver. this chip is a monolithic integrated
circuit(set of circuits in one chip) that senses analog voltage levels and
drives 10 LEDs based on the voltage level, providing a linear analog display.
This chip also allows you to choose from a moving dot display or a bargraph
display by simply connecting a single pin. These chips control the LEDs by
grounding them so you can line them up beside your LED bargraphs and only need
to supply your bargraphs with power. Because I am using two bargraphs I need
two LM3914s. However instead of using two separate LM3914s you can wire them
together creating a seamless display. The LM3914 also allows you to choose the
voltage range you want to display by simply choosing resistors. This is because
pins 7 and 8 on the LM914 act as a voltage regulator. You can set the voltage
range based on this equation:

In my
case because I am using two 10 segment LED bargraphs and want to have an
overall voltage range between 0-5v I arrange the resistors so that each LM3914
has a voltage range of 0-2.5v and 2.6-5v.
The LM3914 also allows you to set the brightness of the LEDs you are powering. You can determine the milliamps being supplied to your LEDs based on this equation:
In short, R1 determines the milliamps being supplied to the your LEDs and the ratio of R2:R1 determines the voltage range. If you are cascading the LM3914 chips like I am, all you need to do is give them the same resistor values, connect them together and they will automatically know that you want an overall voltage range between 0-5v (in my case).
This is an example of how to cascade two LM3914s to drive 20 LEDs:
----------------------------------------------------------------------------------------------------------------------------------
After
deciding how to drive the LEDs I had to figure out how to read and separate the
frequencies. The websites I looked at both used the MSGEQ7 to achieve this task
so I researched the chip and decided that it was the one for me.
----------------------------------------------------------------------------------------------------------------------------------
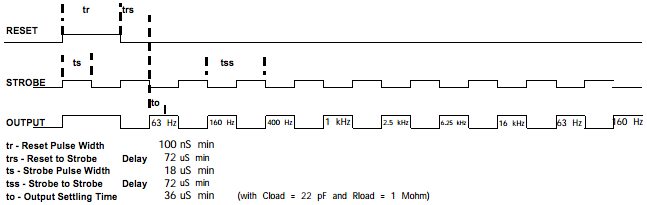
The
MSGEQ7 is a seven band graphic equalizer that divides the audio spectrum into
seven frequencies, 63Hz, 160Hz, 400Hz, 1kHz, 2.5kHz, 6.25KHz and 16kHz. The
frequencies are peak detected (only cares if the pin is high) and multiplexed
to the output to provide a DC representation of the amplitude of each band. The
chip requires an external strobe in order to work. This strobe can be delivered
through hardware (a chip) or through software (I used this method). The strobe
is what advances the multiplexor. When the strobe pin is high the multiplexor
advances by one channel (one of the seven frequencies) and when the strobe is
low the reading from that channel is passed through the output pin of the chip.
The strobe pin will only work if the reset pin is low. If the reset pin is
high, the multiplexor will return to the first channel and will wait until the
reset pin is low and the strobe to start.

----------------------------------------------------------------------------------------------------------------------------------
We can
now drive a single column of our spectrum analyzer. Now the task is to find a
way to drive the other six columns. There are multiple methods of doing this
and the immediate thought is multiplexing. Multiplexing is a valid option but
there is a simpler way. I used a 4017 CMOS counter or commonly called a decade
counter.
----------------------------------------------------------------------------------------------------------------------------------
This chip
has output pins from 0-9. The counter acts somewhat like the multiplexor inside
the MSGEQ7. The chip has a clock pin which when it is high the output pin of
the chip increases by one. The output pin will supply power to whatever is
connected to it. A single output pin of the chip will be connected to all of
the V+ pins of one column of our LED bargraphs. This chip is perfect because if
we connect its clock pin to the same strobe as the MSGEQ7 when the MSGEQ7
outputs the measured frequency the 4017 will display that frequency on the
appropriate column of bargraphs. Now because the 4017 is a decade counter and
we only have 7 columns we connect the pin Out(7) of the 4017 to its reset. We
do this because the 4017 will count from 0-6(giving us 7 outputs) and because
the seventh pin is connected to the reset pin, when its high the counter will
reset. One thing to note is that because the counter is running on a 1/7 duty
cycle the LEDs will seem dimmer than usual because they are turning on and off
so fast.
----------------------------------------------------------------------------------------------------------------------------------
Putting it all together
This is an infinite cycle that happens extremely fast so it appears that all of the LED columns are on at the same time.


 Not complete